![]() ![]() ![]() ![]() |
|
|
|
| ![]() ![]() ![]() |
|   | ![]() ![]() ![]() |
|
# | Concern | Questions | Metric | Goal |
---|---|---|---|---|
I. | User productivity | User Response Time | 6 sec. | |
User Error Recovery Time | 2 sec. | |||
Mean Time to spike in response time | none | |||
Data Size-Response Time Curve | see chart | |||
Load-Response Time Curve | see chart | |||
II. | Operational efficiency: (Maintainability) Stability of the configuration Planned vs. Unplanned Effort | Mean Time Between Failure (MTBF) or Intervention | 1 week | |
Mean Time to Repair (MTTR) | 2 hours | |||
Backup Speed | - | |||
Restore Speed | 1 hour | |||
Restart speed | 5 minutes | |||
Failover speed | 5 seconds | |||
Failback speed | 5 minutes | |||
III. | Stress on the common infrastructure |
Are proportionately greater resources consumed at larger loads? | Resource Consumption (Usage) Rate | - |
Alert Level | - | |||
IV. | Capacity of the configuration
Throughput at various Simultaneous User Loads | Point of Throughput Degradation | - | |
Point of Throughput Rejection | - | |||
Point of Throughput Failure | - | |||
V. | Resource Utilization
(Actions which expand capacity of existing machines) | Component Causing Throughput restriction | database | |
Gain from tuning | ||||
VI. | Capacity for growth | Effectiveness of Load Balancing | 50% | |
Gain from upgrading components | 10% | |||
Gain from changing config. | 10% | |||
Reserve Capacity | 30% | |||
VII. | Extent and Efficiency of Testing Effort (Testability) | Lines to test | 2,000 | |
Hours to run test, write analysis report | 3 hours | |||
Test Runs | 3 each |
This format is based partly on the
Goal/Question/Metric (GQM) method, a practical method for quality improvement of software development,
(McGraw-Hill, 1999)
by Rini van Solingen and Egon Berghout at
www.gqm.nl
|
# | Concern | Questions | Project Technical Objective: Type of Testing |
---|---|---|---|
I. | User productivity | a-e | Conduct speed tests![]() |
II. | Operational efficiency: Stability of the configuration | f-l | Conduct longevity tests Conduct failover tests |
III. | Stress on the common database machine | m-n | Measure the number of bytes between client and server.
Execute the most resource-intensive business processes to
obtain database machine CPU utilitization metrics at various levels of application load |
IV. | Capacity of the configuration | o-q | Conduct stress tests ![]() ![]() ![]()
Continue overload tests |
V. | Resource Utilization | r-s | Repeat Stress and Longevity Tests to determine the impact of various tuning options (such as application software versions, utilities, OS settings, JVM settings, etc.). |
VI. | Capacity for growth | t-w | Conduct Scalability tests![]()
Conduct volume tests |
|
ID | Task Name | BCWS | BCWP | ACWP | SV | CV | EAC | BAC | VAC |
---|---|---|---|---|---|---|---|---|---|
1. |
The baseline developed from project planning efforts provide an "early warning" indicator for the percentage completion progress of the effort.
![]() ![]() |
|
Concern | Possible Discovery | Description / Analysis | Recommendation |
---|---|---|---|
VII. Extent and Efficiency of Testing Effort (Testability) | In HTML, no differentiation of rows for counting among different tables. | In order to obtain a count of items in different tables on the same page, a unique identifier is needed for each type of row. | Add a unique CSS class= attribute to each type of row. This is usually a design requirement. |
I. User Productivity | File returned to client is more than 500,000 bytes. | This guarantees long response times and potential timeouts. | Pre-cache files in smaller pages hidden in sign-up pages or download in background. |
Use of UTF-8 ContentType for English-only pages. | Additional time is required to process vs. ISO-8559-1. | Program specification only for pages which need it. | |
No indication that system is working during long processes. | Users are likely to abandon the session, click refresh, or other actions which cause even more load. | Show a "searching... please wait" screen for responses known to be over 5 seconds. | |
when server is overloaded, users see no screen or technical default text. | Cryptic HTTP "500" error is shown when servers are too busy to respond. | Show a "Busy ... Please Try Again Later" screen to users who are not allowed to login due to server overload. | |
The first user of the day experiences long response times. | Servers wait until users request specific transactions before loading them into memory, a task which may take several minutes. | When server services start, automatically load programs into memory by configuration settings or invoking fake users. | |
Users must make the same filtering selections repeatedly. | Values to filter data specified by each user are not presented again. Retrieving data that users discard consumes CPU, memory, network, and other resources. | Filter out data that users usually don't want. | |
III. Stress on the common database machine | Server error after 5 minutes. | JVM diagnostics graphs showed that memory peaks at 250mb. This is the default value. | Specify -xmx:2000m among JVM startup parameters. |
Server error after 15 minutes. | Parallel graphs of diagnostics showed that the number of Weblogic sessions flattened out at 250. This is the default number. Since the timeout is 20 minutes, runs require 35 sessions per user per minute. | Specify the maximum number of sesssions in the config.xml file. | |
High disk utilization. | 10GB of disk space is consumed per hour of peak load. | In productive system simulations, use "Error" level logging. | |
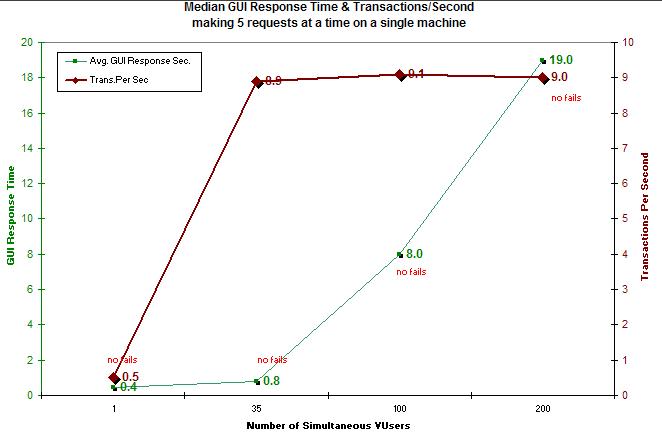
Maximum app loads did not overload the DB server. | The major concern of this project was the impact on the Oracle machine. Runs at the largest application volume increased CPU utilization by no more than 25% with AP transactions, which had the most impact on the server. | Identify and test for the total possible load on the DB running all apps at possible peak loads. | |
II. Operational Efficiency: Stability of the configuration (Readiness of the app. for production) | An image file was not found on page "Xyz". | Microsoft browsers automatically request the favicon.ico file, which generates an error if it's not on the website's root folder. | Workaround: Script loadtest to ignore the "404" error. Root cause: Provide the file with the name expected by the app code or change the code. |
II. Efficient Resource Utilization | 
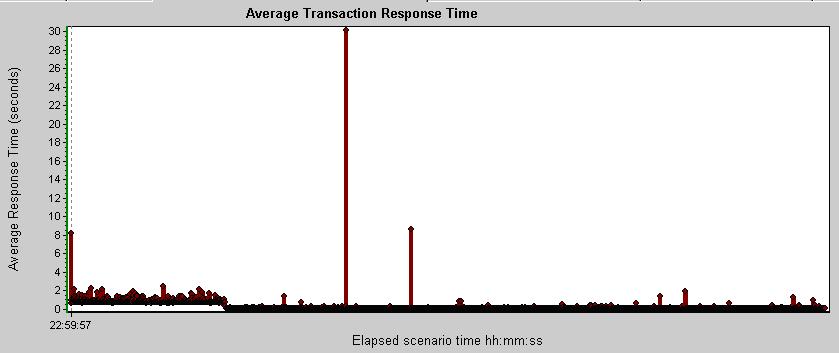
Spikes in performance. | Longevity tests confirm that spikes in response time were eliminated after
changing the JVM run-time setting![]() | |
Server shutdown during overnight runs. | The server shutdown near the end of Longevity tests because it ran out of file handles. When the OS was setup with the maximum rather than the default number of file handles, the app completed longevity tests. An additional temporary workaround is to recycle each process once a day. |
Workaround: Configure the OS with more file handles/descriptors. Root cause: Change app code to explicitly close files. |
To better manage follow-up, action items may be entered into a "defect" tracking system
or task/project management system.
|
Business Process | # Steps | Iteration Time1 | TPM /User | Peak# Users | Max# Users | ||
---|---|---|---|---|---|---|---|
0. | LL | Login / Logout | 2 | 12 s | 0.060 | 300 | 500 |
1. | AP | Accounts Payable [6 lines] | 23 | 8.5 m | 0.160 | 10 | 15 |
2. | JE | GL Journal Entry [14 lines] | 6 | 10 m | 0.001 | 10 | 20 |
3. | RC | GL Report Creation [1 acct] | 5 | 24 s | 0.160 | 25 | 50 |
4. | RR | Report Retrieval | 3 | 12 s | 0.260 | 50 | 100 |
5. | EV | Employee Expense Creation [4 lines] | 2 | 10 m | 0.360 | 100 | 400 |
Combined | 41 | 42 m | 1.001 | 300 | 500 |
# Steps provides for each business process a count of its user dialogs — the number of "round trips" to the server after the user clicks a submit button or a link. This link provided with the number is to a list of the dialogs and the names of transactions measurements.
Iteration Time1 is the total amount of time needed to complete all steps of the business process. (This can be obtained from VuGen during load script development).
TPM /User (Transactions Per minute per User) is the TPS (Transactions Per Second) multplied by 60.
Peak# Users is the peak (largest) number of users that may perform that process all at once, such as (in the case of login) each work-day morning, and (in the case of business processes) around each accounting period-end.
Max# Users is the maximum number of users that can possibly use the specific process all at one time.
|
|
Several metrics that affect the performance and capacity of an application can be obtained even before load testing runs are completed.
These metrics need to be measured manually, with a stopwatch
Or maybe a calendar
We use a test log spiral notebook to record:
This affects the amount of time for testing.
We use a test log spiral notebook to record:
This is deteremined during Failover testing.
| ![]() ![]() ![]() |
| ![]() ![]() ![]() |
|
The contents of this table is described in the above section![]() | From LoadRunner Analysis Summary Report | |||||||||||
Imp. | BP![]() | Manual step (Use Case) | Mix |
Think Time | Trans. ID | Bytes 1 | Speed 1 | Min | Avg | Max | SD | CV |
---|---|---|---|---|---|---|---|---|---|---|---|---|
Must | LL | 1. Invoke homepage URL
![]() | 90% | -- | 1_InvokeURL | 43212 | 3212 | |||||
High | LL | 1.2 Home on main menu ![]() for "Employee facing registry page" ![]() | 40% | -- | 2_ | 43212 | 3212 | |||||
High | LL | 1.3 Logout ![]() | 20% | 2 | 9_ | 43212 | 3212 | |||||
High | TS | 3.1 Time sheet Menu ![]() ![]() | 40% | 2 | TS01 | 43212 | 3212 | |||||
High | TS | 3.2 Lookup ![]() | 22% | 6 | TS02 | 43212 | 3212 | |||||
High | TS | 3.3 Time sheet Entry ![]() ![]() | 38% | 6 | TS03 | 43212 | 3212 |
To better visualize the statistics, this barchart ranks transactions. For each item:
This graph should be generated for a run at a single pace (the same number of virtual users) throughout the run.
| ![]() ![]() ![]() |
| ![]() ![]() ![]() |
| ![]() ![]() ![]() |
| ![]() ![]() ![]() |
![]() ![]() ![]() |
![]() ![]() ![]() |
The mark (very small box) in the middle points to the median (or avarage) of each population. The larger box for each population illustrates the lower and upper quartile of values in that population. The "whiskers" above and below each box illustrates the overall range of the data (the standard deviation). Microsoft Excel users can use a "Volume-Open-High-Low-Close" chart format to approximate a BoxPlot/Box and Whisker Chart.
50-30% = “moderate,” 30-10% = “small,” and less than 10% = “insubstantial, trivial”
![]() ![]() ![]()
All trademarks and copyrights on this page are owned by their respective owners. The rest ©Copyright 1996-2011 Wilson Mar. All rights reserved. Last updated | HTMLHELP | W3C XHTML | CSS | Cynthia 508 |