SAP�s EarlyWatch� online diagnosis and analysis service provides a performance report
based on over 100 screens available from SAPGUI and other utilities
(SAPDBA utility no longer available on SAP 6.40).
| Layer | TSTC | Menu Path | Items |
|---|
| Network
| ST08 | -
| Network Monitor |
| ST09 | -
| Network Alert Monitor |
| SM58 | -
| Asynchronous RFC error log
|
| Requests
| SM13 | -
| Display update requests and resolve errors
|
| SM59 | -
| Display or maintain RFC destinations
|
| Instances
| RZ02 | -
| Network graphics for R/3 instances
|
| RZ04 | -
| Maintain R/3 instances
|
| Servers
| SM51 | -
| List of servers
|
| RZ03 | -
| Control Panel for operation modes and server status
|
| OS
| SM02 | -
| Display SAP System Messages
|
| SM21 | -
| System Log
|
| SM69 | -
| Maintain external operating-system commands |
| SM49 | -
| Execute external operating-system commands. |
| ST06 | TAMP > Operating System > Local
| Operating System Monitor reports load on the CPU and the physical main memory.
(such as what is reported by Unix command lsattr -E1 sys0).
|
| ST07 | TAMP > Operating System > Remote
| Application Monitor reports load on the CPU and the physical main memory by application. |
| App Server
| ST02 | TAMP > Setups/Buffers
| R/3 Memory Configuration Monitor (also known as the function Setups & Tune Buffers).
Its Tune Summary reports load on R/3 buffers and other memory areas.
Buffer hit ratio = Buffer object reads / logical requests.
poor
Buffer Quality = saved database calls / (database calls + saved database calls)
|
| STAT | -
| Single statistics records on the application server.
|
| Work Processes
| SM66 | CCMS > Control/monitoring > Work process overview or
TAMP > Exceptions/Users > Active users > All processes.
| Systemwide Work Process Overview
|
| SM50 | TAMP > System monitoring > Services >
Process Overview
| Local work process load (CPU utilization).
Shows the currently executing WPs on a dialog instance.
|
| ST03 | Workload distribution Monitor
| A technical analysis uses this monitor to identify and analyze problems in the database, R/3 memory management, or R/3 buffers.
An application analysis uses this monitor to identify and analyze transactions, programs, and users that place a heavy load on the system.
|
| DB
| AL02 | -
| Oracle Database Monitor
|
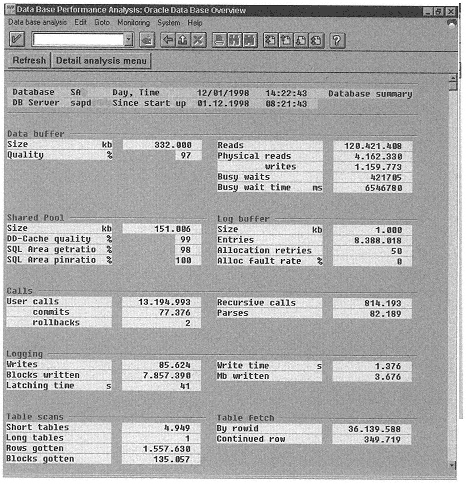
| ST04 | CCMS screen that displays Oracle database activity.
|
 Database Performance Monitor displays
load on the database buffers, database locks, wait situations, read and write access to hard disks, and SQL statements.
Database Performance Monitor displays
load on the database buffers, database locks, wait situations, read and write access to hard disks, and SQL statements.
|
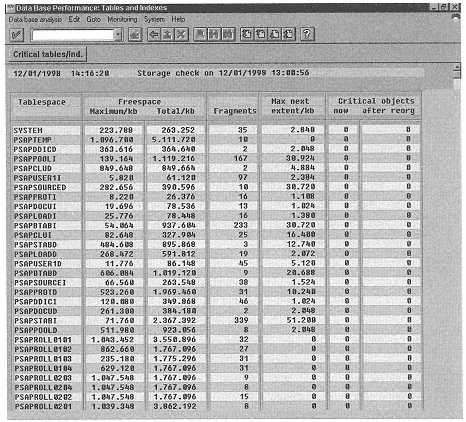
| DB02
| CCMS > Control/Monitoring > Performance Menu > Database > Tables/Indexes > Database Allocation > Detail Analysis (consistency check)
| Analyze tables and indexes (missing database objects and space requirements).
Database Performance:Database Allocation monitor, Check Table Within SQL Server,
the DBCC CHECKDB command locks user tables, indexes and system tables when running.
It is very I/O intensive and should therefore not be run during normal operation, but at times when the system load is low. For more information, see SAP Note 142731 DBCC Checks of SQL Server.
|
| DB12
| CCMS > DB Administration > Backup logs > CCMS Monitoring Tool > Backup history > Logs Backup.
| Overview of backup logs (DBA protocols).
In Backup Restore Information list, find the largest transaction log backup.
Select a row and then History info to find the number of pages backed-up.
Calculate how much free space is left on the transaction log disk by subtracting the
amount of space used in the transaction log is the number of dumped pages, multiplied by 8 KB.
The SAP log file is initially created with a default size of 1 GB, with
the smallest disk normally 9 GB.
|
| DB Tables | AL12 | -
| Display table buffer (buffer synchronization)
|
| DB05 | -
| Table analysis
|
| DB20 | -
| Generate tables statistics
|
| ST10 | TAMP > Setup/Buffers > Calls
| Table Access Statistics
|
| SE16 | -
| Data Browser for displaying table contents.
|
| SM31 | -
| SAP Table Maintenance
|
| SE13 | STUN > Setup/Buffers > Buffers > Goto > Current local data > Table buffers > Single record
| To specify whether or not a table should be buffered.
|
| DB SQL | ST05 | System > Utilities > SQL Trace
| Start, stop, or view
SQL Trace enqueue trace, or RFC trace
within ABAP programs for detailed analysis.
enqueue trace, or RFC trace
within ABAP programs for detailed analysis.
|
| ST11 | -
| Display developer traces.
|
| SE30 | -
| ABAP Trace
|
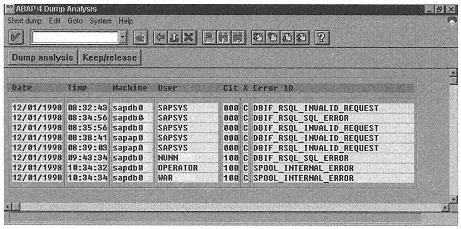
| ST22 | -
|
ABAP runtime error analysis and dump listings
|
| ST01 | -
| R/3 System trace
|
| Locks & Enqueues
| SM01 | -
| Lock Transactions
|
| SM12 | -
| Display and delete R/3 enqueues
|
SMLG provides average response times of the overall system.
ST03N provides response times.

 SAP R/3 User, Data, and Server Administration
 To list users last login, invoke report RSUSR006.

 The preferred method of navigation for the experienced SAPGUI user is to retrieve screens by
name (TSTC code) rather than through the series of pull-down windows
because the screen names do not change between releases of SAP,
but the structure of the pull-down menu path changes frequently as SAP is upgraded.
The preferred method of navigation for the experienced SAPGUI user is to retrieve screens by
name (TSTC code) rather than through the series of pull-down windows
because the screen names do not change between releases of SAP,
but the structure of the pull-down menu path changes frequently as SAP is upgraded.
 dpmon pf=instance profile
